Custom Gantt Chart Development: OLSI Systems Has Led the Way for Over 30 Years
A Gantt chart is a visual project management tool that displays a project's tasks graphically along a timeline. Among other things, it shows:
- Task start and end dates.
- The time required for each task.
- Dependencies between different tasks.
The clear visual language of a Gantt chart helps project managers track progress, spot potential delays, and make decisions in real time.

Key Benefits of Using Gantt Charts
A Gantt chart is not just a graphical representation. It is a powerful management tool that gives you a full layer of control and oversight over every project.
- Clear project planning and organization
- A Gantt chart gives you a bird's-eye view of the schedule, the dependencies between tasks, and the relationships among them.
- Task dependencies: it is easy to see which tasks depend on the completion of others.
- A clear schedule: every team member understands when a task starts and finishes.
- Better time management
- With Gantt charts you can build precise schedules and prevent delays.
- Track actual progress against the plan.
- Spot delays early and address them before they escalate.
- Efficient resource management
- The chart lets you allocate people, equipment, and other resources intelligently.
- Balanced workloads: preventing any single resource from becoming overloaded.
- Smart use: getting the most out of the resources you already have.
- Transparency and collaboration
- Every stakeholder in the project sees the project status clearly.
- Transparency leads to more effective collaboration.
- Responsibilities are clearly divided among team members.
- Informed decision-making. A Gantt chart provides a reliable basis of information for your decisions:
- Long-term planning based on dependencies and schedules.
- A fast response to unexpected changes.
- Forecasting and comparing plan to actual
- A simple comparison between what was planned and what is actually happening.
- Ongoing tracking of schedule changes.
- Correcting gaps in real time.
- Critical Path identification
- Understanding which tasks are critical to finishing the project on time.
- Focusing on the most significant tasks.
- Reducing the risk of delaying the entire project.
- A tool that fits any scale
- Gantt charts work great for both small projects and complex ones with hundreds of tasks.
- You can show a high-level overview or drill down into the finest details.

Why Develop a Custom Gantt Chart?
Off-the-shelf tools like MS Project, Monday, or Asana provide standard capabilities, but they often fall short of the complex needs of different organizations and industries.
By developing a custom Gantt chart, you can:
- Connect the chart to your existing systems (ERP, CRM, production systems).
- Create a tailored user experience: reports, alerts, and the screens that matter to you.
- Save time and money over the long run through full automation.
OLSI Systems Experience: Over 30 Years as a Boutique Software House
OLSI Systems experience: over 30 years as a boutique software house
At OLSI Systems we specialize in developing advanced Gantt charts as part of complex management systems.
Standout advantages of working with us:
- Over 30 years of experience in software development and project management.
- A boutique software house, which means tailor-made solutions rather than a generic product.
- Full integration with your existing systems.
- Development of smart Gantt charts with business intelligence, custom reports, and real-time alerts.
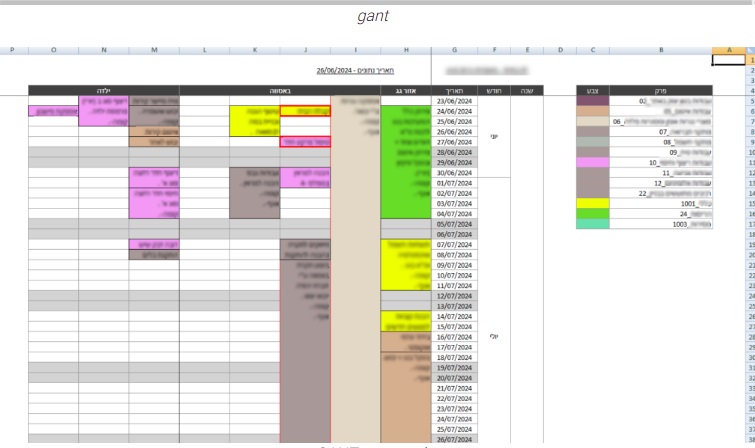
A Gantt Chart Example:
A Gantt chart is an essential tool for any project manager, but when it is tailored to you, it becomes a strategic management tool that raises your organization's level of control and efficiency.
At OLSI Systems, with our deep software development experience, we know how to take the Gantt chart and turn it into an integral part of a complete management system that delivers real results.
Want a custom Gantt chart built for your business's needs?
Leave your details and we'll get back to you or call us at 09-8820511